
September 2, 2026
Intermittent Fasting Calorie Calculator: How It Works
Learn how an intermittent fasting calorie calculator works, what inputs it needs, and how to use the Pretty Progress fasting calculator
You’ve downloaded a fasting app, entered the same age, height, weight, and activity level you used elsewhere, and now you’re staring at a different calorie target. A second calculator gives you another number. A third asks whether you’re following 16:8 or OMAD and seems to change the answer again.
That confusion is understandable. An intermittent fasting calorie calculator isn’t reading a fixed truth from your body. It’s applying assumptions about energy needs, activity, desired deficit, meal frequency, and tracking. Once you understand those assumptions, the output becomes much easier to check and use, including the result from Pretty Progress.
Table of Contents
- Why an Intermittent Fasting Calorie Calculator Feels Confusing at First
- What Inputs Every Fasting Calorie Calculator Asks For
- The TDEE Formula Behind the Numbers
- Dividing Your Daily Target Across Meals and Windows
- Using the Pretty Progress Fasting Calculator in Real Life
- What 2026 Research Says About Fasting Versus Calories
- Putting It All Together for Your Own Plan
Why an Intermittent Fasting Calorie Calculator Feels Confusing at First
A calculator may start with your resting energy needs, estimate how much movement you get during the day, and then apply a deficit for weight loss. Another may use a different equation or classify your activity more generously. A third may divide the daily target across fewer meals, making each meal look much larger without changing the daily total.
Those differences don’t automatically mean one tool is broken. They mean each tool is a model. The model is only useful when its assumptions match what you want to monitor.
The fasting window creates a second layer of confusion
Some tools treat fasting as a scheduling preference. Others present a suggested meal count, fast-day intake, or calorie split. That can make it seem as though a shorter eating window changes the number of calories your body needs.
The more reliable way to read the result is to separate two questions:
- How much energy might you use across the day?
- When do you prefer to eat that energy?
A common calculator workflow collects age, sex, weight, height, activity level, and goal, then estimates total daily energy expenditure, or TDEE, a daily calorie target, and calories per meal. The calculator described by Your Health Calculators supports schedules including 16:8, 18:6, 20:4, 5:2, and OMAD, and uses the simple rule “calories per meal = daily target ÷ number of meals.”
Practical rule: Treat the daily target as the main planning number. Treat the fasting window as the schedule used to distribute it.
That distinction helps you compare apps intelligently. If two tools disagree, inspect their activity assumption and deficit setting before blaming the fasting protocol. A two-meal plan can show a much larger per-meal allowance than a three-meal plan, even when both plans use the same daily target.
What Inputs Every Fasting Calorie Calculator Asks For
Most calculators collect a familiar group of personal details, then add fasting preferences and a goal. Each field changes a different part of the estimate, so accuracy starts with entering realistic information rather than choosing the most flattering activity level.
The personal inputs
- Sex: This helps the equation estimate resting needs, partly because average body composition differs between sexes.
- Age: Resting energy estimates usually account for age because energy needs can change as people get older.
- Height and current weight: These are central to the BMR estimate. Use consistent units and enter your current weight rather than an older target.
- Goal weight: This gives the tool context for the direction of your plan, although the immediate calorie target still depends on estimated maintenance and the selected deficit.
- Activity level: Sedentary, lightly active, moderately active, active, and very active describe movement outside deliberate exercise as well as training. Choose the category that reflects your normal week, not your most active day.
- Fasting protocol: Common choices include 16:8, 18:6, 20:4, OMAD, and custom schedules. This primarily controls timing and meal distribution.
- Deficit intensity: Some calculators offer mild, moderate, or aggressive settings. The selected level determines how far the target sits below estimated maintenance.
- Eating-window timing: A schedule such as noon to 8 p.m. turns the abstract protocol into a usable routine. It can also help you place meals around work, sleep, and training.
Pretty Progress uses the same general onboarding logic, connecting personal information and goals with a chosen fasting schedule. Its intermittent fasting duration calculator is useful when you already know your start and end times and want to check the length of the fast.
| Input Field | What It Controls | Pretty Progress Equivalent |
|---|---|---|
| Sex, age, height, and weight | The starting energy estimate | Personal details entered during setup |
| Goal and goal weight | Direction and planning context | Weight goal selected during onboarding |
| Activity level | Estimated daily movement | Activity selection in the calculator flow |
| Fasting protocol | Timing and meal structure | Selected fasting schedule |
| Deficit intensity | Distance below estimated maintenance | Calorie-target preference |
| Eating-window timing | When meals fit into the day | Fast start and end settings |
If you also want to understand how protein, carbohydrates, and fat fit inside the calorie target, this guide to macro counting for fat loss offers useful background. Macros don’t replace the calorie target, but they can make meals more filling and easier to plan.
The TDEE Formula Behind the Numbers
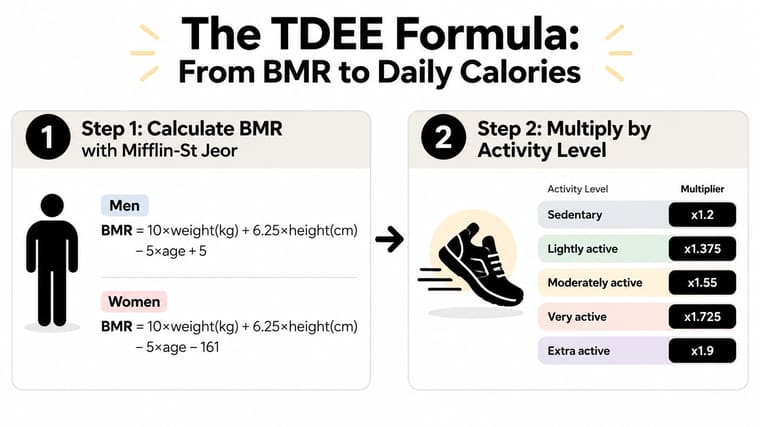
The daily number usually begins with basal metabolic rate, or BMR. BMR estimates the energy your body uses at rest. A calculator then multiplies BMR by an activity factor to estimate TDEE, which represents a broader daily maintenance estimate.
The Mifflin-St Jeor equations are:
- Men: 10 × weight in kilograms + 6.25 × height in centimeters − 5 × age + 5
- Women: 10 × weight in kilograms + 6.25 × height in centimeters − 5 × age − 161
A worked example
Take a 35-year-old woman weighing 70 kilograms, standing 168 centimeters tall, and describing her routine as lightly active.
First, insert the values into the women’s equation:
10 × 70 + 6.25 × 168 − 5 × 35 − 161
That produces a BMR of approximately 1,491 calories. To estimate TDEE, multiply that result by the lightly active factor of 1.375:
1,491 × 1.375 = approximately 2,050 calories
A 15% deficit then gives:
2,050 × 0.85 = approximately 1,743 calories per day
The rounding is normal. Food labels, portion estimates, and activity classifications are also estimates, so the useful goal is a consistent starting point that you can review against your real-world progress. Resources such as tracking total calories with OneTwenty can help you think about total intake as a daily tracking measure rather than treating fasting hours as a separate source of calorie burn.
Check your inputs before changing your plan. A surprising result often comes from an activity category or deficit setting that doesn’t match your routine.
Dividing Your Daily Target Across Meals and Windows
Suppose your daily target is 2,000 calories. The fasting schedule doesn’t create a new target. It changes how you place those calories inside the eating window.
| Fasting Window | Eating Window | Meal 1 | Meal 2 | Optional Meal 3 | Total Calories |
|---|---|---|---|---|---|
| 16:8 | 8 hours | 700 | 1,300 | None | 2,000 |
| 18:6 | 6 hours | 1,000 | 1,000 | 500 snack | 2,000 |
| 20:4 | 4 hours | 1,000 | 1,000 | None | 2,000 |
| OMAD, 23:1 | 1 hour | 2,000 | None | None | 2,000 |
These splits are examples, not rules. A 16:8 schedule might suit a smaller first meal followed by a larger dinner. That first meal could combine Greek yogurt, fruit, oats, and a protein source, while dinner could include lean protein, vegetables, rice or potatoes, and a source of fat. The important check is the daily sum.
An 18:6 schedule gives you more room to divide intake into two substantial meals and a snack. You might use the snack for fruit and yogurt, a sandwich, or another convenient combination rather than trying to force every calorie into two sittings.
Shorter windows require more planning
With 20:4, two dense meals may be easier than one enormous plate. Build each around protein, fiber-rich plants, a carbohydrate source, and fat, then adjust portions until the combined total matches the target. OMAD concentrates the full allowance into one sitting, which is possible for some people but can feel uncomfortable and makes food quality and portion planning more important.
The source calculator’s meal formula, daily target divided by the number of meals, explains why the same target can look so different across schedules. Log each meal in Pretty Progress as you eat it, so the remaining daily allowance reflects actual intake rather than memory.
Using the Pretty Progress Fasting Calculator in Real Life
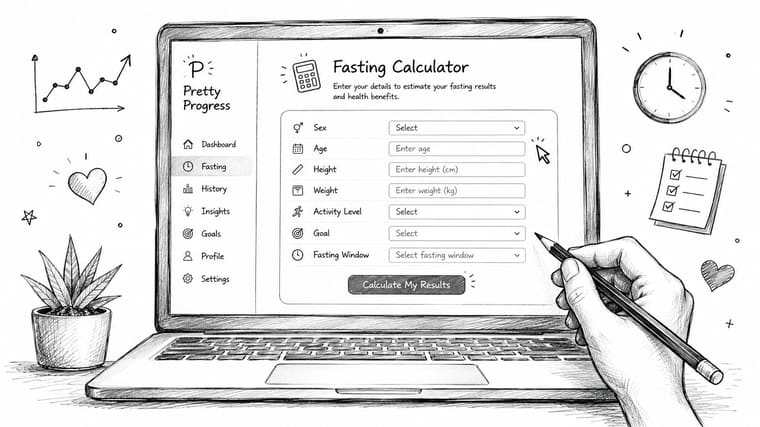
Start by opening Pretty Progress and selecting the fasting calculator from the tools area. Enter your sex, age, height, current weight, activity level, goal, and preferred fasting window. Use your ordinary activity pattern, because an inflated activity choice can make the resulting target harder to evaluate.
The result screen is designed to bring the main pieces together. It shows the estimated TDEE, the target after the selected deficit, and a suggested meal split. You can compare those values with the hand calculation from the TDEE section and check whether the assumptions feel reasonable.
Turn the result into a visible routine
Tap Add to Tracker to convert the daily calorie result into a recurring goal inside the main app. Then open the Widget Gallery, choose a small or medium calorie layout, and place it on your iPhone or iPad Home Screen. The widget keeps the target visible during your eating window, so you don’t have to reopen the calculator every time you plan a meal.
Log foods as you eat them. The remaining-calorie display is only useful when it reflects real intake, including snacks, drinks, and small additions that are easy to forget. For a broader routine, the intermittent fasting tracker guide can help you connect fasting times with daily progress.
Your fasting schedule may need extra flexibility around work, sleep, symptoms, or changing routines. Readers considering a fasting schedule for perimenopause should treat the timing as adjustable rather than forcing a window that leaves them feeling unwell. Revisit the target periodically as your body weight and activity pattern change, instead of assuming the first calculation remains appropriate forever.
What 2026 Research Says About Fasting Versus Calories
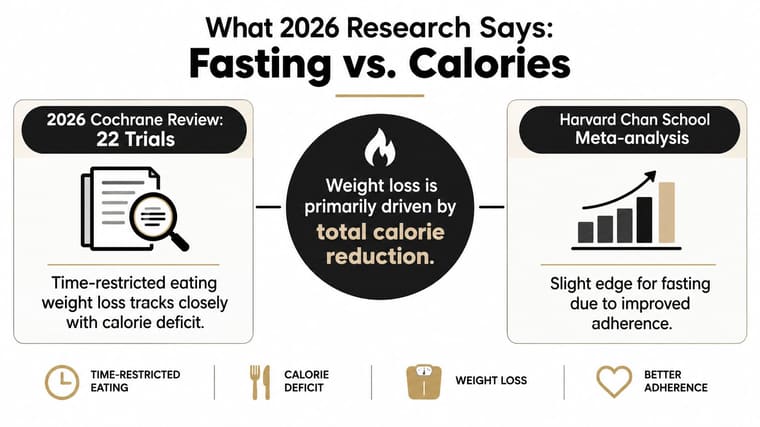
The most important correction to fasting-calculator marketing is simple: fasting hours don’t automatically create a separate calorie equation. A 2026 Cochrane review covering 21 studies and 1,430 people found little to no difference between intermittent fasting and regular dietary advice for percentage body-weight loss, with a mean difference of -0.33 and a 95% confidence interval from -0.92 to 0.26. It also found little to no difference in reaching a 5% weight-loss threshold, with a relative risk of 0.98 and a 95% confidence interval from 0.82 to 1.18. The review is available through PubMed.
That doesn’t make fasting useless. It changes the question. A schedule can provide structure, reduce opportunities to eat, or fit someone’s routine better. But the calculator should focus on a realistic weekly energy deficit and consistent intake, not promise extra loss simply because meals occur inside a shorter window.
A systematic review of 27 trials found weight loss ranging from 0.8% to 13.0% of baseline body weight across interventions, while also noting that weight loss occurred regardless of changes in overall calorie intake. Those varied outcomes reinforce the need to interpret fasting results by protocol, duration, adherence, and total intake rather than searching for one universal fasting result.
A controlled 4:3 trial illustrates why individualized calculations matter. Researchers measured resting energy expenditure, estimated maintenance calories, and set intake to create a 34% weekly energy restriction. Fast-day targets fell around 400 to 600 calories for women and 500 to 700 calories for men, and 58% of intermittent-fasting participants reached at least 5% weight loss at 12 months, compared with 47% in the daily-calorie-restriction group. The study design and findings are summarized by CU Anschutz.
Putting It All Together for Your Own Plan
Use the calculator as a planning aid, not a verdict. Start by estimating maintenance calories with your personal inputs, then choose a deficit that feels realistic. If you use a 500-calorie deficit, subtract it from estimated maintenance, divide the resulting target across your preferred eating window, and load that number into a Pretty Progress tracker or widget.
The same daily target can support 16:8, 18:6, or 20:4. The schedule changes meal timing and portion distribution, not the underlying energy target. Your two practical adjustment points are activity level and deficit size, so change those only when your routine or experience justifies it.
Keep a simple record of meals, hunger, energy, and adherence. Recalculate after every 10 pounds of weight change or every six weeks, whichever comes first, so the plan reflects current inputs. A visual weight-loss progress tracker can make that review easier by keeping the trend visible rather than leaving the decision to day-to-day fluctuations.
Pretty Progress combines fasting and calorie calculators with Home Screen widgets that keep your daily target and progress visible while you follow your chosen eating window. Visit Pretty Progress to set up your calculator result, add it to your tracker, and turn your plan into a reminder you can see throughout the day.